
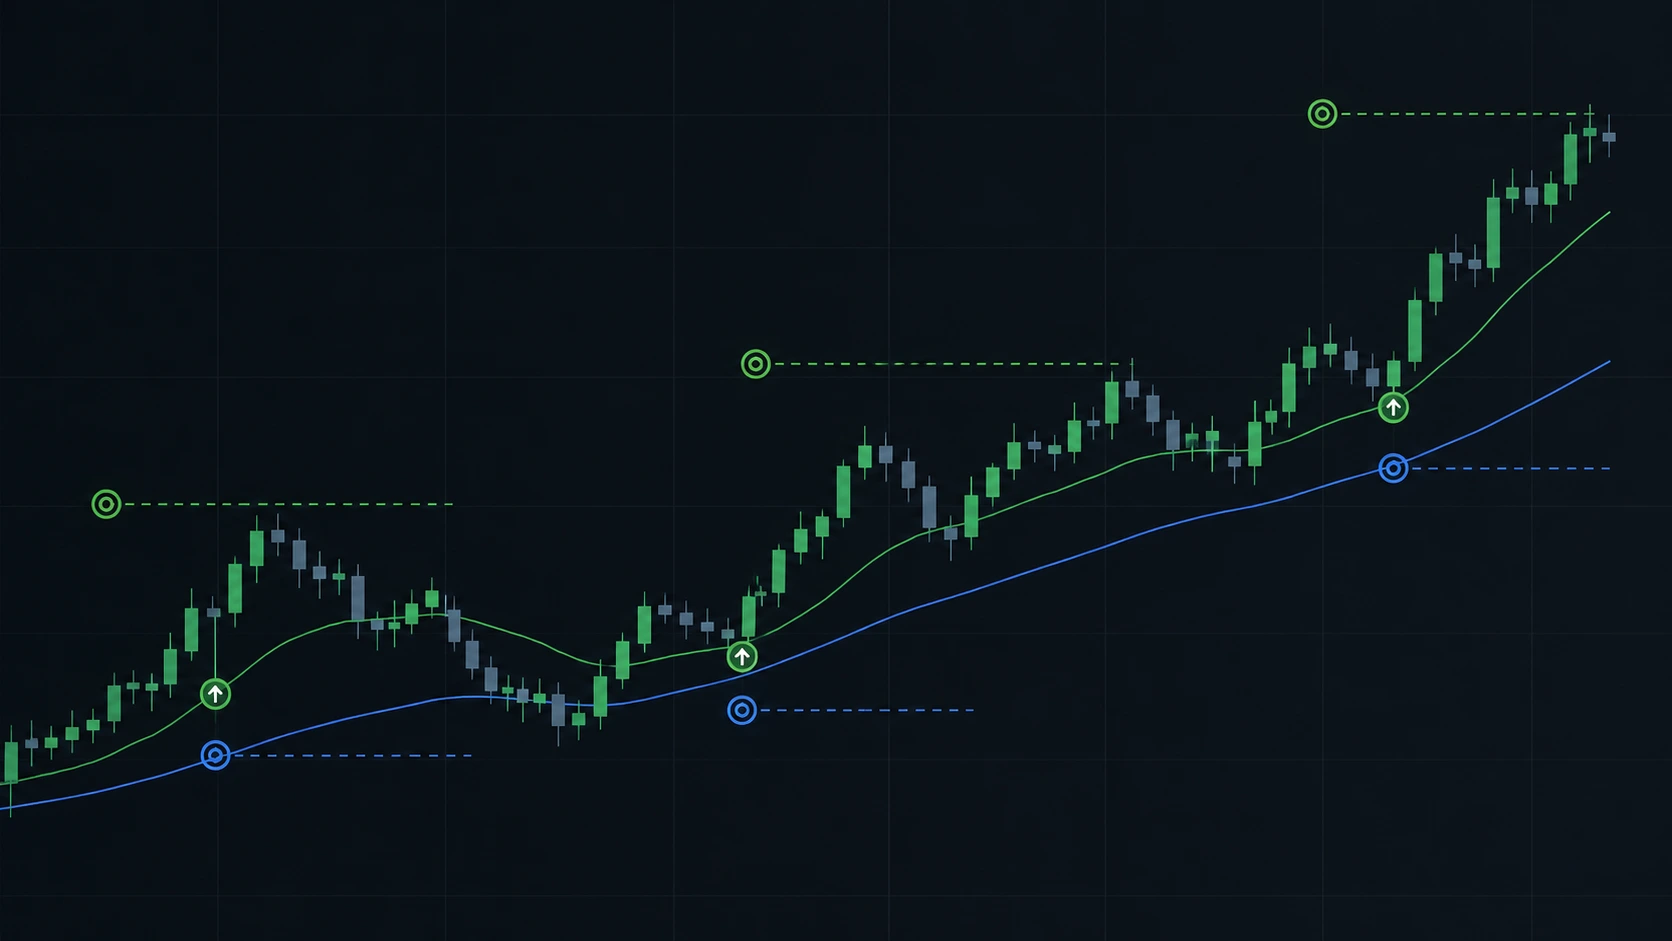
A TradingView indicator can tell you where a signal appears. A strategy has to answer a much harder question: what would actually happen if we traded that signal?
That difference sounds small, but converting an indicator into a reliable
backtestable system requires more than replacing a few
plotshape() calls with entry orders.
A useful strategy needs defined entries, exits, position rules, realistic trading costs, controlled signal timing, and protection against misleading historical results.
In this article, we'll look at the main engineering decisions involved in turning an existing Pine Script indicator into a structured TradingView strategy — without building an entire trading system from scratch.
An Indicator Describes the Market. A Strategy Simulates Decisions.
Consider an indicator that already identifies a valid long setup. Its internal logic might combine several conditions:
trendBullish =
    close > trendFilter

momentumConfirmed =
    momentumValue > momentumThreshold

longSignal =
    trendBullish and momentumConfirmed
As an indicator, that may be enough to display an arrow or change the chart background.
A strategy needs additional rules.
- Can another trade open while a position is already active?
- What price invalidates the trade?
- How is the take-profit calculated?
- Should opposite signals reverse the position?
- What happens when several signals appear consecutively?
This is where indicator logic starts becoming trading-system logic.
Start with the Strategy Declaration
A Pine strategy uses strategy() instead of
indicator().
A simplified declaration may look like:
//@version=6

strategy(
    "FLECTA Strategy Test",
    overlay = true,
    initial_capital = 10000,
    pyramiding = 0,
    commission_type = strategy.commission.percent,
    commission_value = 0.08,
    slippage = 2
)
These settings are not decoration. They influence how the Strategy Tester interprets the system.
For example, allowing multiple entries with pyramiding can produce completely different results from a system designed to hold only one position at a time.
Commission and execution costs matter as well, especially when the strategy trades frequently.
Keep Signal Logic Separate from Order Logic
One of the cleanest ways to convert an indicator is to keep its original signal engine separate from the strategy execution layer.
Conceptually:
Market Data
     ↓
Indicator Logic
     ↓
Signal State
     ↓
Strategy Rules
     ↓
Entry / Exit Simulation
The indicator portion might calculate:
longSignal  = trendBullish and momentumConfirmed
shortSignal = trendBearish and momentumWeak
The strategy layer can then decide whether those signals are actually allowed to create a trade.
canEnterLong =
    longSignal and
    strategy.position_size == 0
This separation is useful because the same market logic can later support alerts, visual signals, or a completely different execution model without rewriting everything.
Turning a Signal into an Entry
Once the trade conditions are defined, Pine can simulate an entry using
strategy.entry().
if canEnterLong
    strategy.entry(
        "Long",
        strategy.long
    )
The important part is not the function itself.
The important part is deciding what makes canEnterLong true.
In a more realistic project, that condition could include:
- trend direction
- momentum confirmation
- volatility conditions
- session filters
- higher-timeframe confirmation
- minimum distance from previous entry
The strategy should model the actual trading rules rather than simply turning every visual marker into an order.
Entries Are Only Half of the Backtest
A surprisingly common mistake is spending most of the development effort on entry logic while using an arbitrary exit.
But the same entry signal can produce very different performance depending on how positions are managed.
A basic system might calculate a stop and target from the entry price:
riskDistance = atrValue * riskMultiplier

stopPrice =
    entryReference - riskDistance

targetPrice =
    entryReference + riskDistance * rewardRatio
The calculated levels can then be connected to an exit order:
strategy.exit(
    "Long Exit",
    from_entry = "Long",
    stop = stopPrice,
    limit = targetPrice
)
This creates a much more meaningful test than simply closing the position when an unrelated opposite signal appears.
Why Trading Costs Belong in the Backtest
A strategy that looks attractive before costs can behave very differently after commission and slippage are included.
This becomes especially important for systems with:
- many trades
- small average profit per position
- tight stop-loss levels
- lower timeframes
A professional backtest should therefore use assumptions that are at least reasonably close to the intended market and execution environment.
The goal is not to perfectly reproduce a broker inside TradingView. The goal is to avoid testing a version of the strategy that could never exist in real trading.
The Repainting Problem
A beautiful historical signal is useless if the same signal behaves differently while the candle is still forming.
This is one of the first things that should be reviewed when converting an indicator into a strategy.
Some indicators intentionally use live intrabar information. That is not automatically wrong.
The problem appears when a historical backtest assumes information was stable at a moment when it was not actually confirmed in real time.
For strategies designed around closed candles, signal confirmation can be made explicit:
confirmedLongSignal =
    longSignal and
    barstate.isconfirmed
This gives the strategy a much clearer rule: the setup does not exist until the bar has been confirmed.
Multi-Timeframe Logic Needs Extra Care
A common TradingView project uses a lower timeframe for entries and a higher timeframe for direction.
For example:
Entry timeframe: 15m
Trend timeframe: 4H
The strategy might allow a 15-minute long setup only while the higher-timeframe market remains bullish.
This type of logic is often built with request.security().
But multi-timeframe data must be handled carefully. A script should not accidentally use future higher-timeframe information in historical bars.
This is one of those areas where an indicator may appear visually correct while its strategy version produces an unrealistically strong backtest.
Visuals Still Matter After Conversion
Turning an indicator into a strategy does not mean removing its visual tools.
In fact, keeping selected plots can make validation much easier.
A useful strategy chart might still show:
- the main trend filter
- entry markers
- stop-loss levels
- take-profit levels
- higher-timeframe state
This allows you to visually compare what the strategy believed with the trades shown by the Strategy Tester.
If a trade appears where the visual conditions do not agree with the entry logic, that is usually a sign that something deserves investigation.
Do Not Judge the Strategy by Net Profit Alone
Once the strategy runs, the first number most people look at is net profit.
That number alone says very little about the quality of the system.
A more useful review also considers:
- maximum drawdown
- profit factor
- average trade
- number of trades
- average winning and losing trade
- performance across different market periods
A system producing excellent results from 14 historical trades deserves a very different level of confidence from one that has behaved consistently across hundreds of independent opportunities.
Be Careful with Optimization
Once parameters are exposed as inputs, it becomes tempting to search for the combination that produces the highest historical return.
For example:
Fast Length:     17
Slow Length:     43
ATR Multiplier:  1.73
Reward Ratio:    2.65
A highly specific combination can look impressive precisely because it has been fitted to historical noise.
A healthier question is whether the system remains reasonable when the inputs change slightly.
If changing one parameter from 17 to 18 completely destroys the strategy, the backtest may be showing optimization sensitivity rather than a robust trading idea.
Indicator Conversion Is Really Strategy Design
The biggest mistake is thinking that converting an indicator to a strategy is a mechanical programming task.
It usually requires decisions that were never defined in the original indicator:
- exact entry timing
- position state
- risk and exit rules
- signal confirmation
- trading costs
- multi-timeframe behavior
Two strategies can use exactly the same indicator and still produce completely different results because those execution rules are different.
Final Thoughts
A TradingView indicator tells us when something interesting happened on the chart.
A strategy forces us to define what we would actually do about it.
A well-structured conversion should therefore:
- preserve the original analytical logic
- separate signal generation from execution rules
- define entries and exits explicitly
- include realistic trading costs
- control repainting and signal timing
- handle higher-timeframe data carefully
- evaluate more than headline profitability
The result is not simply an indicator with BUY and SELL commands attached.
It is a testable model of how the trading idea is expected to behave.
TradingView Strategy Development with FLECTA
FLECTA develops custom Pine Script indicators and TradingView strategies for projects that need structured signal logic, backtesting, risk management, multi-timeframe analysis, custom alerts, and automation-ready outputs.
Existing indicators can also be converted into strategy versions when the entry, exit, and execution rules are defined clearly enough to produce a meaningful test.
The objective is not to manufacture an attractive historical equity curve. It is to turn the original trading logic into a system that can be tested, reviewed, and improved in a controlled way.
Comments 0
Questions, technical notes, and useful additions are welcome.
Be the first to leave a useful note about this article.
Leave a comment
Your comment may be reviewed before it appears publicly.