
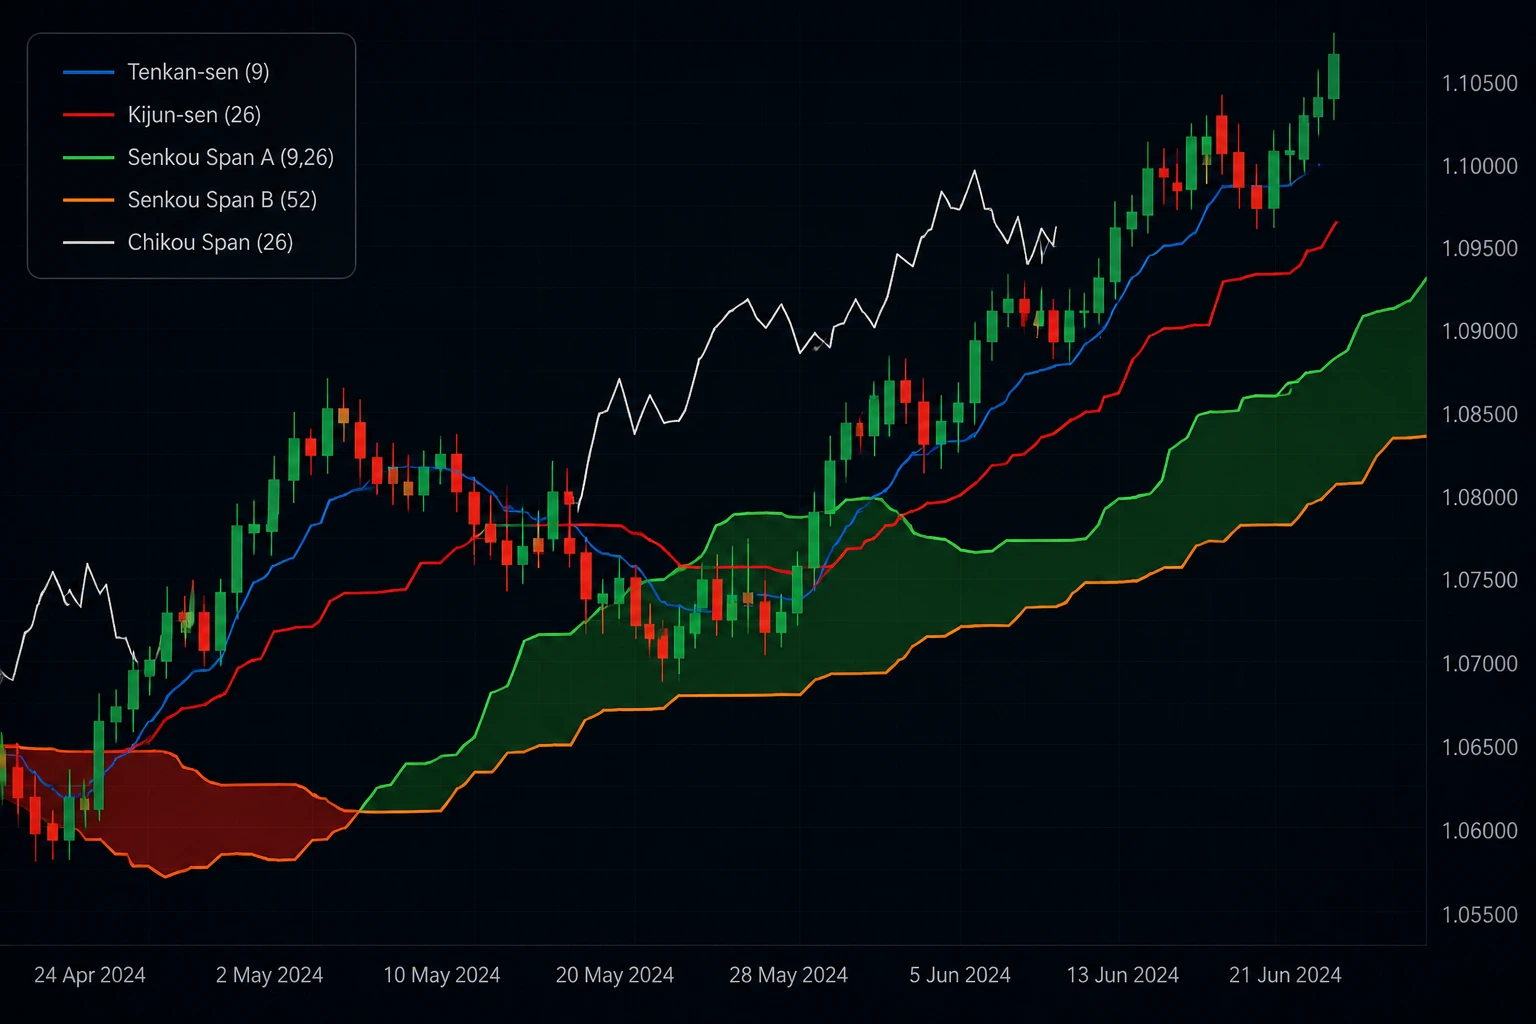
Ichimoku Kinko Hyo is one of those indicators that looks intimidating at first glance.
Several lines, a projected cloud, historical confirmation, and multiple periods are displayed at the same time — yet underneath the chart, the logic is surprisingly structured.
That makes Ichimoku a good example of a more serious MQL4 indicator project: it requires multiple buffers, historical calculations, forward and backward plot shifts, and clear separation between calculation and signal logic.
In this article, we'll look at how a custom Ichimoku-style indicator can be structured in MetaTrader 4 without turning the code into an unnecessarily complex project.
What Makes Ichimoku Different?
Unlike a simple Moving Average or RSI, Ichimoku is not based on a single line. It combines several calculations into one market structure.
The standard indicator contains five main components:
- Tenkan-sen — short-term market balance
- Kijun-sen — medium-term reference line
- Senkou Span A — first boundary of the future cloud
- Senkou Span B — second boundary of the future cloud
- Chikou Span — current price plotted into the past
The common periods are:
Tenkan = 9
Kijun  = 26
Senkou = 52
The interesting part from an MQL4 perspective is not only calculating these values.
Some of them must also be displayed at a different position on the chart.
The Core Calculation
Tenkan-sen and Kijun-sen are not Moving Averages.
They use the midpoint between the highest high and lowest low over a selected period:
Line = (Highest High + Lowest Low) / 2A reusable helper function keeps this logic clean:
double GetMidpoint(
   const double &high[],
   const double &low[],
   int start,
   int period
)
{
   double highest = high[start];
   double lowest  = low[start];

   for(int i = start; i < start + period; i++)
   {
      if(high[i] > highest)
         highest = high[i];

      if(low[i] < lowest)
         lowest = low[i];
   }

   return (highest + lowest) / 2.0;
}
The same function can now calculate different Ichimoku components simply by changing the period.
Using Multiple Indicator Buffers
A custom Ichimoku indicator needs separate buffers because every component represents a different data series.
#property indicator_chart_window
#property indicator_buffers 5

double TenkanBuffer[];
double KijunBuffer[];
double SenkouABuffer[];
double SenkouBBuffer[];
double ChikouBuffer[];
During initialization, the buffers are connected to the indicator:
int OnInit()
{
   SetIndexBuffer(0, TenkanBuffer);
   SetIndexBuffer(1, KijunBuffer);
   SetIndexBuffer(2, SenkouABuffer);
   SetIndexBuffer(3, SenkouBBuffer);
   SetIndexBuffer(4, ChikouBuffer);

   SetIndexStyle(0, DRAW_LINE);
   SetIndexStyle(1, DRAW_LINE);
   SetIndexStyle(2, DRAW_LINE);
   SetIndexStyle(3, DRAW_LINE);
   SetIndexStyle(4, DRAW_LINE);

   return(INIT_SUCCEEDED);
}
At this point the indicator has five independent output channels that can be calculated, styled, and used later by an Expert Advisor.
The Important Part: Forward and Backward Shifts
This is where Ichimoku becomes more interesting than a normal indicator.
Senkou Span A and Senkou Span B are projected forward on the chart, while Chikou Span is displayed behind the current market.
MQL4 can handle the visual displacement using
SetIndexShift():
SetIndexShift(2, 26);
SetIndexShift(3, 26);

SetIndexShift(4, -26);
The calculation remains attached to its actual candle. The platform simply changes where that buffer is drawn.
Keeping calculation and visualization separate is important because the EA should never confuse a visually shifted value with future market data.
Calculating the Indicator
A simplified calculation loop can look like this:
int OnCalculate(
   const int rates_total,
   const int prev_calculated,
   const datetime &time[],
   const double &open[],
   const double &high[],
   const double &low[],
   const double &close[],
   const long &tick_volume[],
   const long &volume[],
   const int &spread[]
)
{
   int max_period = 52;

   if(rates_total <= max_period)
      return(0);

   int limit = rates_total - max_period;

   for(int i = limit; i >= 0; i--)
   {
      TenkanBuffer[i] =
         GetMidpoint(high, low, i, 9);

      KijunBuffer[i] =
         GetMidpoint(high, low, i, 26);

      SenkouABuffer[i] =
         (TenkanBuffer[i] + KijunBuffer[i]) / 2.0;

      SenkouBBuffer[i] =
         GetMidpoint(high, low, i, 52);

      ChikouBuffer[i] =
         close[i];
   }

   return(rates_total);
}
This is intentionally a simplified version.
A production indicator should also use
prev_calculated to avoid unnecessarily recalculating the complete
history on every tick.
Turning the Cloud Into Useful Information
Drawing Ichimoku correctly is only half of the project.
The real value appears when the indicator converts its components into useful market states.
For example, a bullish environment might require:
Price > Cloud
Tenkan > Kijun
Senkou A > Senkou B
A bearish environment could require the opposite:
Price < Cloud
Tenkan < Kijun
Senkou A < Senkou B
Instead of generating a BUY or SELL signal from one crossover, a custom indicator can classify the market into states such as:
- Bullish trend
- Bearish trend
- Inside cloud
- Weak confirmation
- Strong confirmation
That information can later be exposed to an Expert Advisor through indicator buffers.
A More Practical Custom Version
In client projects, reproducing the standard Ichimoku indicator exactly is usually not the most interesting part.
The useful work starts when the indicator is adapted to the strategy.
For example, a custom version could include:
- configurable Ichimoku periods
- colored bullish and bearish cloud zones
- Tenkan/Kijun crossover alerts
- cloud breakout detection
- higher-timeframe trend confirmation
- push and Telegram notifications
- signal buffers for Expert Advisors
- a compact dashboard showing multiple symbols
At that point, the project is no longer just an indicator clone.
It becomes a reusable analysis module.
Multi-Timeframe Ichimoku
One particularly useful extension is combining the current chart with a higher timeframe.
For example:
Current chart: M15

Trend filter: H1 Ichimoku
An EA could take an M15 bullish breakout only when price is also above the H1 cloud.
In MQL4, the higher-timeframe values can be accessed using the built-in
iIchimoku() function or through a custom indicator interface.
The important part is correctly mapping candles between the two timeframes rather than assuming that candle indexes are identical.
Common Implementation Mistakes
Most Ichimoku bugs are not caused by the formula itself. They usually come from buffer handling and candle indexing.
Typical problems include:
- shifting the calculation instead of only shifting the visual buffer
- reading Senkou values from the wrong candle
- recalculating the entire history on every tick
- using higher-timeframe indexes directly on a lower timeframe
- generating repeated alerts from the same candle
These issues become especially important when the indicator is later connected to an automated trading system.
Indicator First, Trading Logic Second
A clean architecture keeps the indicator responsible for market analysis.
The Expert Advisor remains responsible for:
- position sizing
- risk management
- order execution
- trade management
For example:
Ichimoku Indicator
        ↓
Market State
        ↓
EA Signal Filter
        ↓
Risk Engine
        ↓
Trade Execution
This makes the indicator reusable and allows the trading logic to evolve without rebuilding the entire analysis layer.
Final Thoughts
Ichimoku is a good example of what separates a basic custom indicator from a more structured MQL4 project.
The formulas themselves are not extremely difficult.
The real challenge is managing multiple buffers, correctly handling chart shifts, working with historical data, preventing duplicate signals, and exposing clean information to other parts of a trading system.
A professional implementation should therefore focus on more than simply drawing five lines on a chart.
It should create a reliable analysis component that can later support alerts, dashboards, multi-timeframe confirmation, or automated execution.
Custom MQL4 Indicators with FLECTA
FLECTA develops custom MQL4 and MQL5 indicators for projects that require more than standard MetaTrader tools.
Complex signal logic, multi-timeframe analysis, custom buffers, dashboards, alerts, visual trading tools, and Expert Advisor integration can all be built into a structured indicator designed around a specific strategy.
The goal is not simply to reproduce an existing indicator — it is to turn its logic into a tool that fits the actual trading workflow.
Comments 2
Questions, technical notes, and useful additions are welcome.
test1
test comment in login
nice
it was helpful
Leave a comment
Your comment may be reviewed before it appears publicly.